
ROH in dogs:
what DNA can tell us about inbreeding
Runs of homozygosity (ROH) reveal patterns that an inbreeding coefficient cannot show.
A pedigree coefficient remains useful, but it relies on ancestry records rather than DNA.
A genomic coefficient uses DNA data, yet a single value cannot show how homozygosity is distributed across the genome.
Before planning a mating or assessing a breeding dog’s value, breeders must therefore consider ROH.
Key points
A single number can be reassuring. That applies to both pedigree and genomic inbreeding coefficients. One uses recorded ancestry; the other uses DNA data. Neither, on its own, shows the pattern of homozygosity across the genome.
The problem is relying on a percentage to make the whole decision. A pedigree may miss older or poorly recorded shared ancestry. A genomic coefficient can provide a more informative estimate, but still does not show whether homozygosity lies mainly in shorter stretches or several long regions.
The answer is to bring these sources of evidence together. ROH show where homozygous regions occur, how long they are and what their distribution suggests about recent and more distant shared ancestry.
The key point is simple: the pedigree opens the assessment, the genomic inbreeding coefficient improves it, but ROH make it truly interpretable. Moving from a number to a structure changes the level of analysis.
Why pedigrees do not tell the whole story
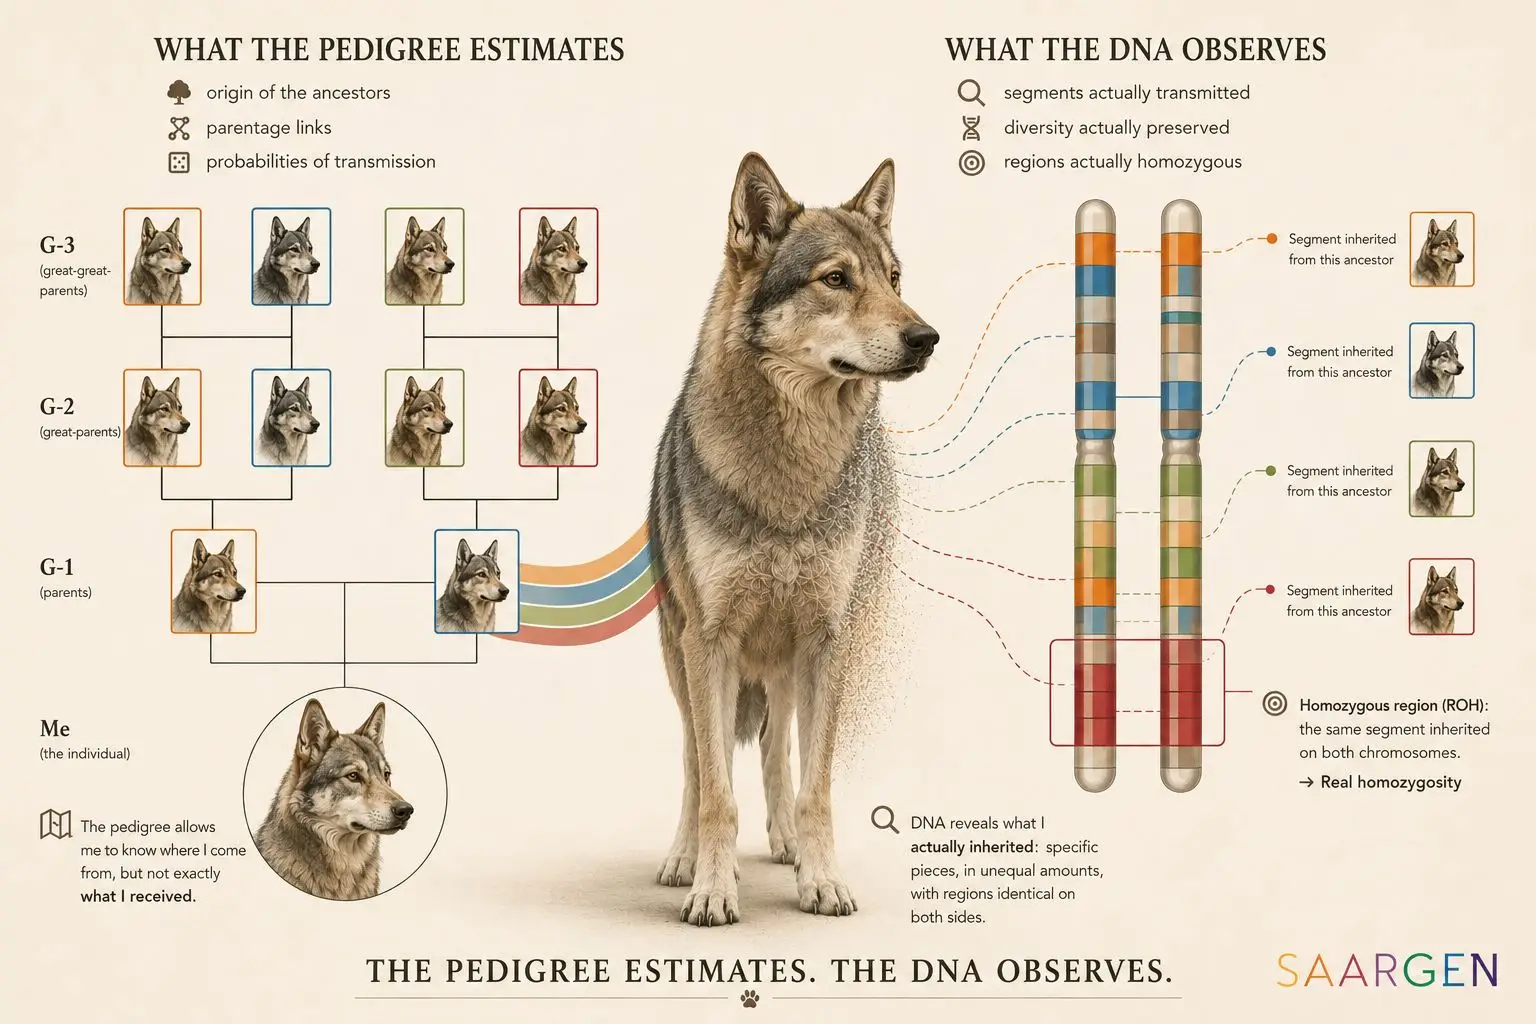
Pedigrees are often the starting point for discussing inbreeding in dogs. They identify shared ancestors, help compare proposed matings and provide an initial estimate.
That estimate has a limitation: it describes an expectation based on ancestry, rather than directly examining a dog’s DNA. It predicts what might be inherited, rather than measuring the particular combination of chromosomal segments the dog received (Kardos et al., 2015).
Genetic recombination reshuffles DNA in every generation. Two dogs from the same litter therefore have different allele distributions. Dogs with the same pedigree coefficient can therefore differ in their realized genomic inbreeding (Knief et al., 2017).
Why a genomic inbreeding coefficient is still only part of the picture
Examining DNA is already a clear improvement over using a pedigree alone. A genomic inbreeding coefficient is based on what is actually observed in the dog’s genome. It is therefore not limited in the same way by pedigree depth or by the absence of shared ancestors in recent ancestry records.
But this does not resolve everything. A complex reality is still being summarized in a single number. Homozygosity is not distributed uniformly across the genome: it may be diffuse, fragmented, or concentrated in several long chromosomal regions.
In other words, two dogs can have similar genomic inbreeding coefficients without having the same genetic structure. One may carry mainly short segments, while the other has several long ROH concentrated in certain regions of the genome. These two profiles do not call for the same level of vigilance from the breeder.
This is precisely why ROH are needed. They complement pedigree and genomic inbreeding coefficients by showing how homozygosity is organized across the genome, rather than only how much of it there is overall.
What is a ROH in dogs, in practical terms?
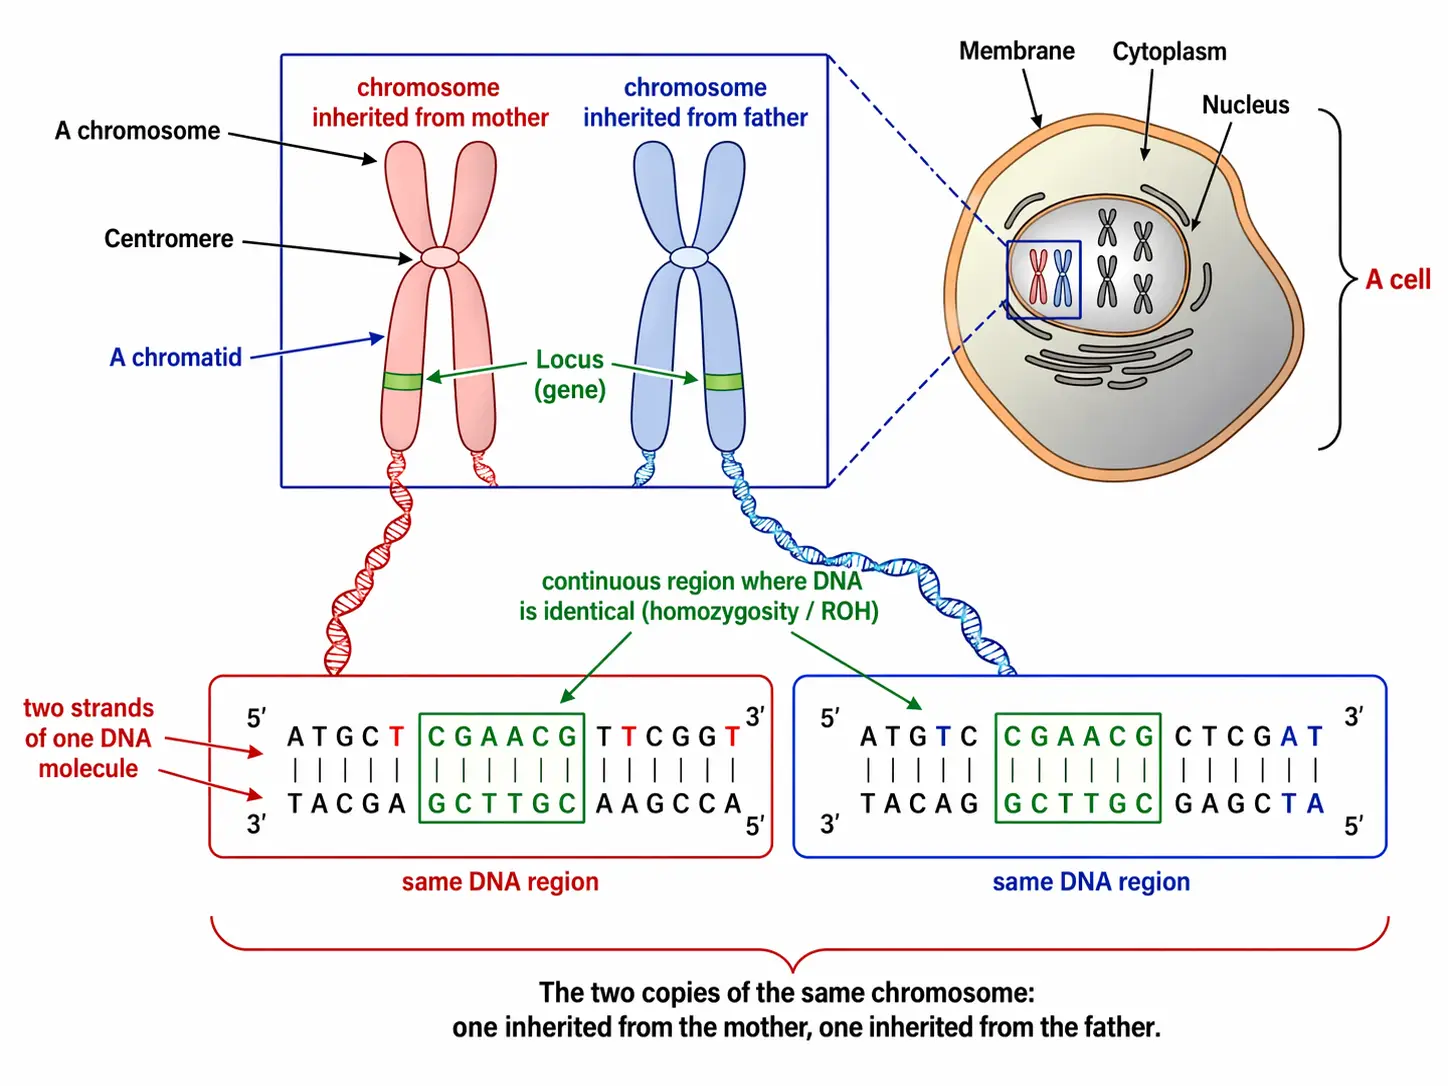
A run of homozygosity, or ROH, is a continuous genomic region that is homozygous across the markers examined.
For each autosome, a dog inherits one copy from its father and one from its mother. When the two copies carry matching alleles across a sufficiently long series of markers, an analysis can identify an ROH.
This is more than homozygosity at a single locus: it is a stretch of the genome. Its length provides clues to the history of the ancestry shared by the two copies.
ROH can be detected using large panels of single-nucleotide polymorphisms (SNPs). Whole-genome sequencing is not essential, but marker density and the parameters used to call ROH must be appropriate and consistent (Meyermans et al., 2020).
This image shows a simplified map of ROH along the chromosome pairs of a Saarlooswolfdog.
Each gray bar represents the portion of the chromosome pair covered by the analyzed genetic markers.
The orange areas within these gray bars correspond to detected ROH: stretches of the genome where the two copies of DNA inherited from the father and mother are identical over a certain length.
The more numerous and extensive these orange zones are, the greater the proportion of the analyzed genome is homozygous.
Here, they occupy a large portion of many chromosomal regions, which is consistent with the high genetic inbreeding rate of 43 % indicated below the graph.
This representation therefore makes it immediately possible to see what a simple percentage does not show: where homozygosity is located in the analyzed regions of the genome and how it is distributed from one chromosome to another.
ROH in purebred dogs: very different genetic profiles
We use ROH to better understand a dog's inbreeding. But their distribution across the chromosomes also allows us to visualize how homogenized its genome is.
Let’s compare, for example, the simplified ROH maps shown below for two dogs, each belonging to a recognized breed.
In the former, many chromosomes are traversed by segments of homozygosity, several of which are long.
In the second, these segments are much fewer in number and occupy a much smaller fraction of the genome.
The difference then becomes obvious.
The first dog has numerous regions where the two copies of its chromosomes are identical over large lengths.
The second, on the contrary, retains more regions where the paternal and maternal copies differ. Its genome therefore exhibits less extensive homozygosity.
Above all, this comparison shows that a low level of ROH is not limited to mixed-breed dogs.
Some dogs from established breeds can also retain relatively low homozygosity and valuable individual genomic diversity.
This depends on the breed’s history, the size and structure of its population, the bottlenecks it has experienced, the number of founders, and the breeding practices applied over the generations.
ROH thus help us move beyond an oversimplified idea: being a purebred dog does not automatically mean having a highly homogenized genome.
What matters is the actual genetic history of the population from which the dog originates.
How recombination helps us interpret ROH
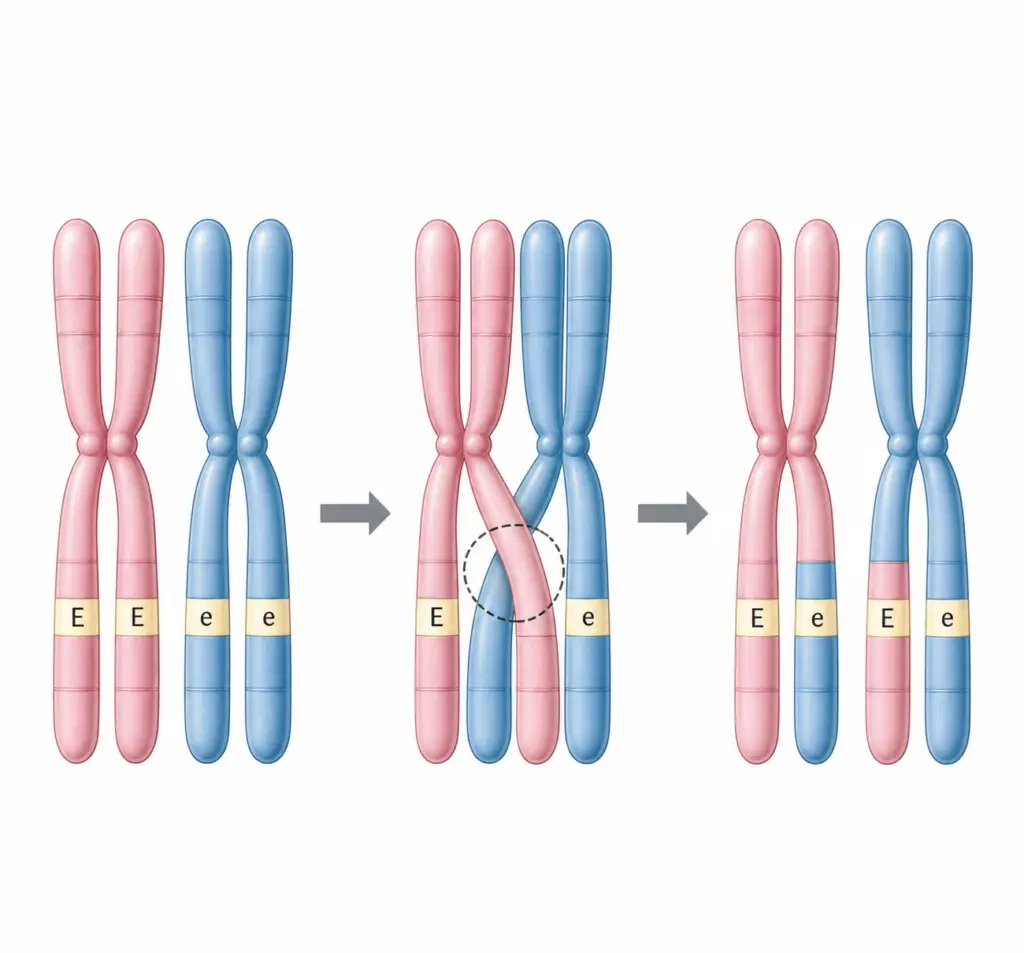
Chromosomes are not always passed down as intact copies from one generation to the next.
During egg and sperm formation, homologous chromosomes can exchange segments. Over successive generations, recombination tends to break up regions inherited from shared ancestors. The longer a segment has been transmitted, the more opportunities there have been for it to be shortened (Knief et al., 2017).
ROH length therefore offers a clue to the age of shared ancestry.
Long runs are more often associated with recent shared ancestors. Shorter runs can reflect more distant ancestry, population history or regions influenced by selection. (Sumreddee et al., 2020).
ROH in dogs: how to read short, medium, and long segments
ROH do not all tell the same story. The longest ROH more often correspond to segments identical by descent, or IBD, inherited from a relatively recent common ancestor.
Short ROH, by contrast, are often older or more ambiguous. They may reflect accumulated homogeneity within the breed or regions made common through selection for certain phenotypic traits. In these cases, we more readily speak of IBS — identity by state — although the boundary is not absolute.
In practice, simple reference ranges are often used:
- short ROH below 2.5 Mb;
- medium ROH between 2.5 and 5 Mb;
- long ROH above 5 Mb.
Mb means megabase, or one million DNA bases. These are useful guides, not universal laws: they also depend on the density of the SNP markers used to identify them and the analysis parameters chosen (Meyermans et al., 2020).
ROH length and the number of generations
The length of a ROH can provide an order of magnitude for the probable age of the observed homozygosity. These are not exact equivalences, but useful reference points for relating the size of a segment to an approximate genealogical depth.
The longer a segment of homozygosity is, the more likely it is to be recent.
ROH ≥1.5 Mb: can indicate a relatively ancient homozygosity, on the order of about fifty generations. This also shows that part of the homozygosity visible in the DNA can date back well beyond the usual depth of pedigrees used in breeding.
ROH ≥ 5 Mb : suggests more recent homozygosity, on the order of about ten generations
ROH ≥ 10 Mb : suggests very recent homozygosity, around five generations
Indicative benchmarks: these orders of magnitude remain approximate. They serve to locate the probable age of a segment, not to convert Mb into an exact number of generations.
The three simplified ROH maps show the same dog B, whose inbreeding coefficient is only 3%.
Only the ROH display threshold changes; the dog’s genetic history stays the same.
- At ≥1.5Mb, 20 segments for a total of 71.10 Mb.At this display threshold, we see the dog’s “genetic identity card.”
- At ≥ 5Mb, 4 segments for a total of 32.21Mb.This display threshold highlights more recent homozygosity.
- At ≥ 10Mb,, 1 segment for a total of 13.93 Mb.This display threshold highlights very recent inbreeding.
Note: this long homozygous segment is present on all three maps. Only the shorter ROH disappear as the display threshold increases.
The higher the threshold, the more the view focuses on recent inbreeding: segments that have not yet had time to be broken into smaller pieces by genetic recombination, which occurs during meiosis in each generation.
The long segment visible at the ≥10 Mb display threshold warrants examining shared ancestry in the pedigree and the recent history of those ancestors.
However, this long segment does not identify a particular ancestor or establish that a segment comes from a specific generation.
An ancestor appearing more than once in a pedigree remains useful genealogical information. Linking a particular ROH to that ancestor would require suitable family data and inheritance analysis.
Long ROH in dogs: why they deserve special attention
For a breeder, not all ROH carry the same weight in a decision. Long ROH deserve particular attention because they reflect more recent diversity loss concentrated in specific parts of the genome.
In dogs, Sams and Boyko also observed more than 678 harmful homozygous recessive genotypes across 29 loci. Their finding is particularly striking: 90% of these genotypes overlapped an ROH. Most were contained in ROH longer than 5 Mb, although 14% also appeared in short ROH of 0.5–2.5 Mb (Sams & Boyko, 2019).
Rigor remains essential, however.
A long ROH alone does not predict disease. It primarily flags a region requiring vigilance, because it increases the probability of concentrating the same recessive variants on both chromosomes.
ROH profiles in dogs: how the same inbreeding level can mask different patterns
Consider two males of the same breed with nearly identical genomic inbreeding coefficients. At first glance, without a ROH analysis, one might assume that their profiles are the same. In reality, one may carry several long ROH concentrated in particular regions of the genome, while the other shows mostly shorter, more fragmented segments.
And that difference matters!
In the first case, the loss of diversity is more concentrated and more recent. In the second, homozygosity is more diffuse.
The overall percentage may seem comparable, but the genetic structure is not.
In other words, the question is no longer simply “How much?” as indicated by an inbreeding coefficient, but also “Where?” and “In what form?” .
This is precisely where ROH provide a useful complement to the genomic inbreeding coefficient.
The two maps above show two breeding males: two Saarlooswolfdogs with similar SaarGen COIs of 30%.
At first glance, judging only by their matching inbreeding coefficients, one might assume that their profiles are similar. Yet they differ!
One presents 15 ROH for a total length of 293.88 Mb.
The other has 25 ROH for a total length of 410.50 Mb.
These segments are also distributed differently along the chromosomes.
The two males have similar inbreeding coefficients, but different genetic structures. In other words, the question is not only “How much?” but also “Where?” and “In what form?”
The total length and the length of each segment must also be considered: a dog with fewer ROH may still have longer ones. The number alone is therefore insufficient to choose between two breeding dogs.
These two dogs call for different levels of vigilance from the breeder, particularly when choosing a female for a future litter. The aim is to avoid concentrating the same recessive variants carried on the prospective parents’ chromosomes.
Why this becomes a population issue in a closed breed
In a closed breed, inbreeding is not solely the result of a few close matings. Shared ancestry increasingly becomes a feature of the wider population.
The same bloodlines recur, some breeding animals contribute disproportionately, and available options narrow. Even careful breeders may have to choose between dogs that are already closely related.
The Saarlooswolfdog illustrates this constraint.
In a restricted population, assessing a proposed mating requires more than a pedigree coefficient. Breeders also need to consider the variation that remains, the homozygous regions present and how to avoid repeatedly concentrating the same ancestry (Bannasch et al., 2021).
Why ROH matter when choosing future mating combinations
For breeders, the question becomes practical: what can ROH contribute when planning a future mating?
First, they make it possible to look beyond a single overall percentage.
Two dogs may look acceptable on pedigree and produce a litter with a satisfactory genomic inbreeding coefficient, yet carry long ROH in nearby or overlapping regions. This overlap does not automatically mean that a clinical problem will occur. It does, however, warrant attention.
Next, this assessment helps evaluate how the two profiles complement each other.
The aim is not to find a dog “without ROH,” which would not make sense in a closed population. The challenge is to limit the re-concentration of the same long homozygous segments as much as possible and to prioritize combinations with greater precision.
Finally, ROH challenge assumptions that may seem reassuring. A mating may look promising on paper yet remain questionable if the two profiles concentrate the same already highly homozygous regions.
By maintaining this new level of attention, we are helping to reduce the overall inbreeding more effectively.
That is why ROH matter before a litter is conceived, as well as afterward.
The two maps above show the distribution of ROH ≥10 Mb in a male and a female selected for a future mating. The maps suggest that ROH occur in the same regions on several chromosomes, sometimes overlapping partially and sometimes completely.
Segments occupying the same positions are first highlighted in orange to flag shared ROH regions.
The first map therefore highlights 4 shared ROH regions in orange, located in the same regions of the same chromosomes.
The second map then examines the alleles within these ROH regions: in addition to occupying the same positions, do they carry the same alleles?
In this example, four stretches ≥10 Mb are highlighted in red, with the same homozygous alleles at every shared marker with available data.
Note: if both parents carry two copies of the same allele at a given marker, their puppy will also inherit two copies of that allele at that position.
This is what makes this assessment useful before the mating.
This does not mean that a disease will occur or that every DNA base in the region is known. The aim is to identify regions where the combination retains the same homozygosity, complementing the other information used to select breeding dogs.
How this informs SaarGen’s approach
In a conservation program, this approach must extend beyond occasional assessments of a few matings and become part of a population strategy.
Lowering a theoretical percentage is not always enough. A population can appear to improve while retaining an unfavorable pattern of homozygosity. The real issue is therefore not the number alone, but how segments persist, fragment, or change over time.
An approach such as SaarGen aims to work at precisely this level: not simply obtaining a more reassuring pedigree, but reintroducing useful genetic variation, gradually fragmenting long ROH, and restoring more functional diversity within the population.
Individual profiles are therefore assessed using complementary criteria: ROH structure, overlap of long ROH in future matings, available diversity, health, temperament, breed type, and population goals.
ROH do not become the sole decision-making tool; they become an important criterion within a more robust method.

What to take away
The pedigree inbreeding coefficient remains useful for interpreting ancestry.
The genomic inbreeding coefficient goes further by examining DNA as actually observed.
Neither figure alone, however, explains how homozygosity is organized within the genome. The benefit for breeders is clear: considering a structure, not merely a percentage.
ROH show where homozygous regions lie, how long they are and why some combinations warrant greater vigilance than others.
Before judging a mating or breeding dog, therefore, look beyond the pedigree and genomic inbreeding coefficient. Examine the ROH, their distribution and any overlap.
The pedigree opens the assessment.
The genomic coefficient refines it.
ROH make it truly useful.
Frequently Asked Questions
Sources
Scientific references
The sources below informed this article.
Links to the relevant publications are included in the text.
1- Bannasch, D., et al. (2021). The effect of inbreeding, body size and morphology on health in dog breeds. Canine Medicine and Genetics, 8(1), 12.
2- Kardos, M., Luikart, G., & Allendorf, F. W. (2015). Measuring individual inbreeding in the age of genomics: marker-based measures are better than pedigrees. Heredity, 115(1), 63-72.
3- Knief, U., Kempenaers, B., & Forstmeier, W. (2017). Meiotic recombination shapes precision of pedigree- and marker-based estimates of inbreeding. Heredity, 118(3), 239-248.
4- Meyermans, R., Gorssen, W., Buys, N., et al. (2020). How to study runs of homozygosity using PLINK? BMC Genomics, 21, 94.
5- Sams, A. J., & Boyko, A. R. (2019). Fine-Scale Resolution of Runs of Homozygosity Reveal Patterns of Inbreeding and Substantial Overlap with Recessive Disease Genotypes in Domestic Dogs. G3, 9(1), 117-123.
6- Sumreddee, P., et al. (2020). Runs of homozygosity and analysis of inbreeding depression. Journal of Animal Science, 98(12), skaa361.